TL;DR: Google Search Console (GSC) is the most accurate free keyword research tool available because the data comes directly from Google. It shows every query that triggered your pages, your average ranking position, click-through rate, and impression count. This guide walks you through every filter, tab, and research technique inside GSC so you can find low-hanging fruit, spot intent mismatches, cluster semantic keywords, and prioritize content improvements, without spending a single dollar.
Most people open Google Search Console, glance at the clicks chart, and close it. They are leaving a gold mine untouched.
Every query your site has ever ranked for is sitting inside that Performance tab. Every keyword where you are ranking on page two but getting zero clicks. Every seasonal spike. Every intent mismatch killing your CTR. Every branded search your audience runs before they convert.
I have been using GSC as my primary keyword research tool for years. Not as a replacement for Ahrefs or Semrush, but as the foundation. Third-party tools estimate data. GSC gives you the real numbers, straight from Google.
This tutorial covers every practical use case I use inside GSC for keyword research, from finding low-hanging fruit to identifying dying keywords to monitoring your brand. If you want to watch me walk through the entire process, I recorded a step-by-step video:
What Makes GSC Different from Other Keyword Tools?
Google Search Console is a free communication channel between Google and site owners. The data inside it is organic-only, first-party, and pulled directly from Google Search, not estimated from click models or panel data.
That makes it unique. Tools like Semrush and Ahrefs are excellent for competitor research and keyword discovery. But they are estimating your traffic. GSC is telling you the truth.
The key limitation: GSC only shows you keywords where your site already receives impressions. If you have never published content on a topic, GSC will not suggest keywords for it. It is not a discovery tool for brand-new markets. For that, you need a tool like the Semrush Keyword Magic Tool or a free keyword brainstorming method.
Setup requirement: If your site is brand new, you need to publish content first and let Google index it. Then wait roughly three months before the data in GSC becomes meaningful enough to act on. Running GSC on a new site with 10 posts and one month of data will give you almost nothing useful.
Once you have content and three-plus months of history, GSC becomes one of the most powerful SEO tools in your workflow.
The Performance Tab: Your Keyword Research Hub
Everything in this guide starts at the Performance tab in GSC. You can access it from the left sidebar or from the homepage of your property.
When you land on it, you see four core metrics at the top:
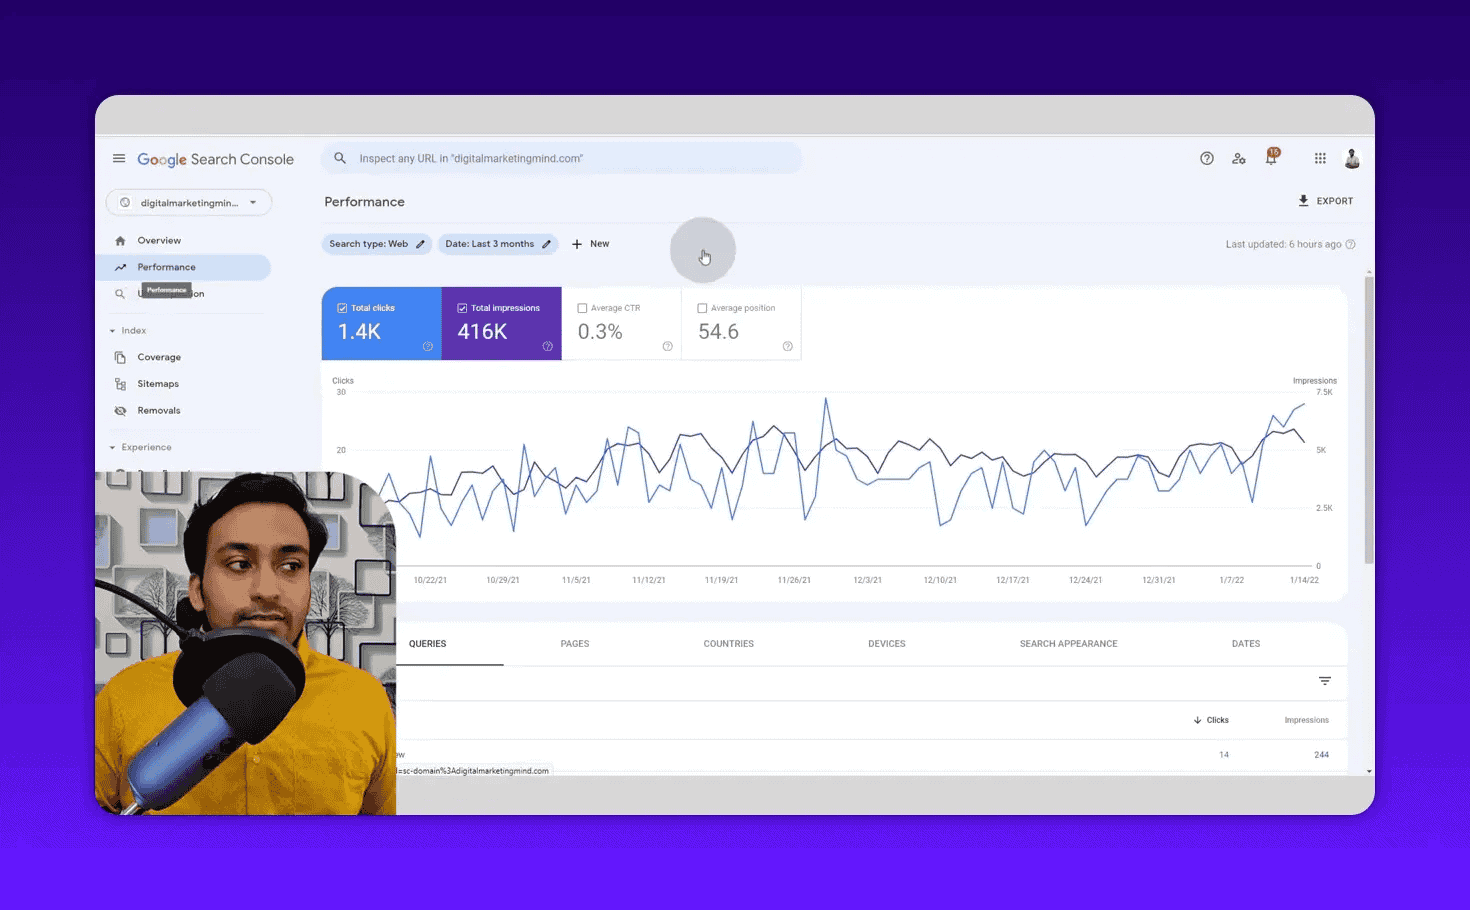
- Clicks: The number of people who clicked through to your site from Google Search
- Impressions: How many times your pages appeared in search results (whether anyone clicked or not)
- Average CTR: Clicks divided by impressions, tells you how compelling your titles and snippets are
- Average Position: Your mean ranking across all tracked keywords (lower is better)
Your goal is simple: increase clicks and CTR, decrease average position. Everything we do in this guide is designed to move one of those four numbers.
Step 1: Configure Your Filters Before Digging In
Set the Date Range to 12-16 Months
By default, GSC shows 3 months of data. Change this immediately. Click the Date filter and select Last 16 months (or 12 months if that is not available).
More data means more keywords in the Queries table. GSC caps the table at 1,000 rows per view, so maximizing your date range gives you the broadest possible keyword set to work with.
Understand the Search Type Filter
The first filter at the top is Search type. It defaults to Web, which covers your standard organic rankings.
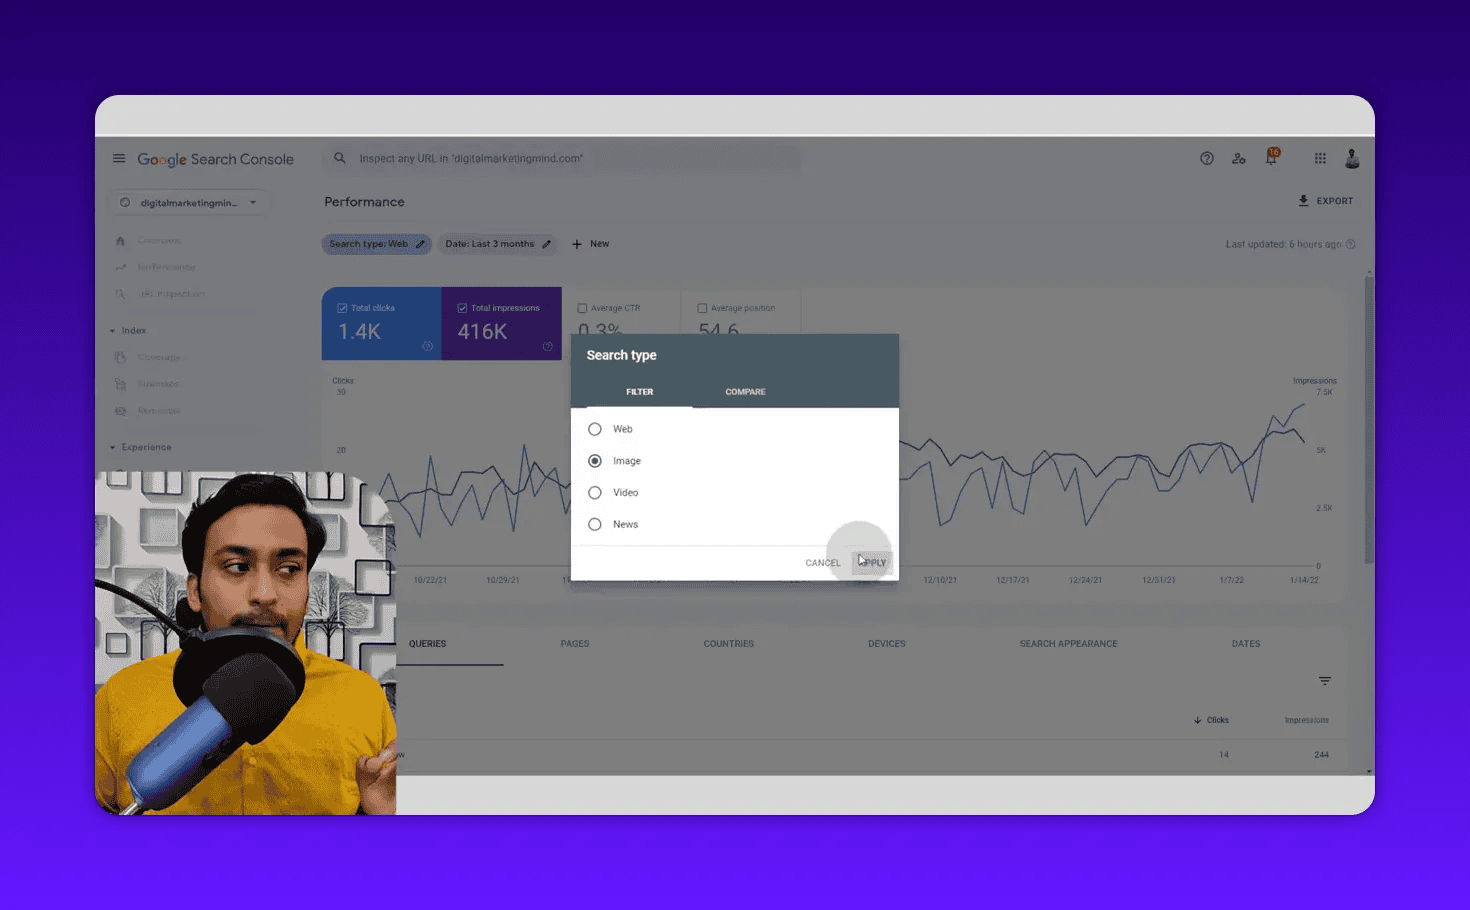
You can switch to Image, Video, or News to see rankings specifically in those sections of Google. If you run a recipe site, the image search data tells you which images are getting impressions. If you publish video content, the video section shows your YouTube embed rankings.
For most keyword research purposes, keep this on Web.
Step 2: Read the Queries Table Correctly
Scroll down past the chart and you see the Queries table. This is the core of your keyword research.
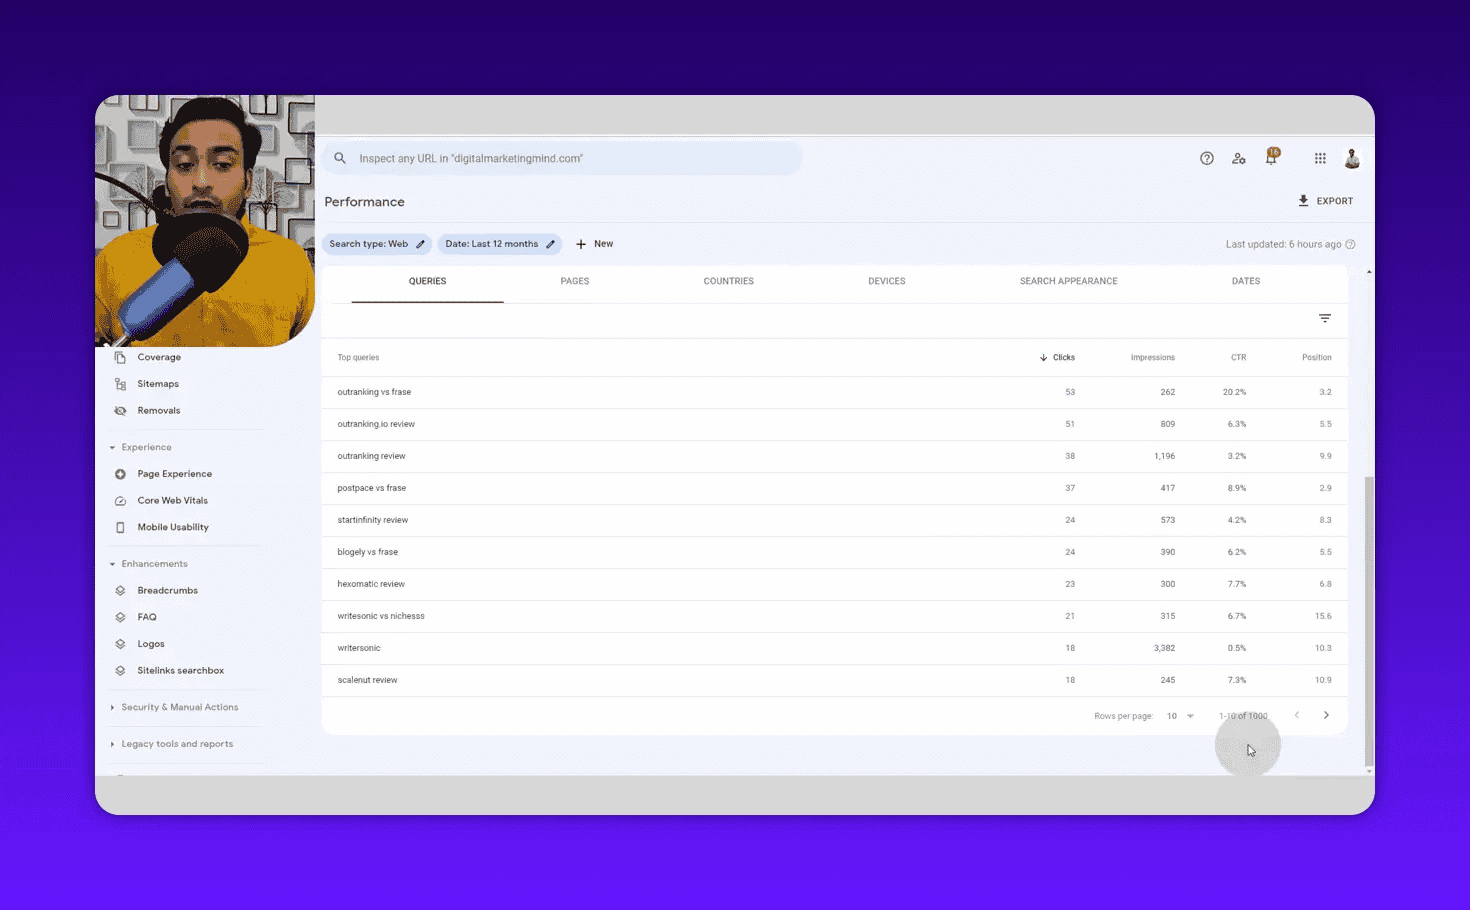
Every row is a search phrase someone typed into Google that triggered one of your pages. The columns show:
- How many clicks that query generated
- How many impressions it received
- Its CTR
- Your average ranking position for it
You can show or hide any column using the checkboxes at the top. Sort by impressions to see your highest-volume keywords. Sort by position to see where you rank highest.
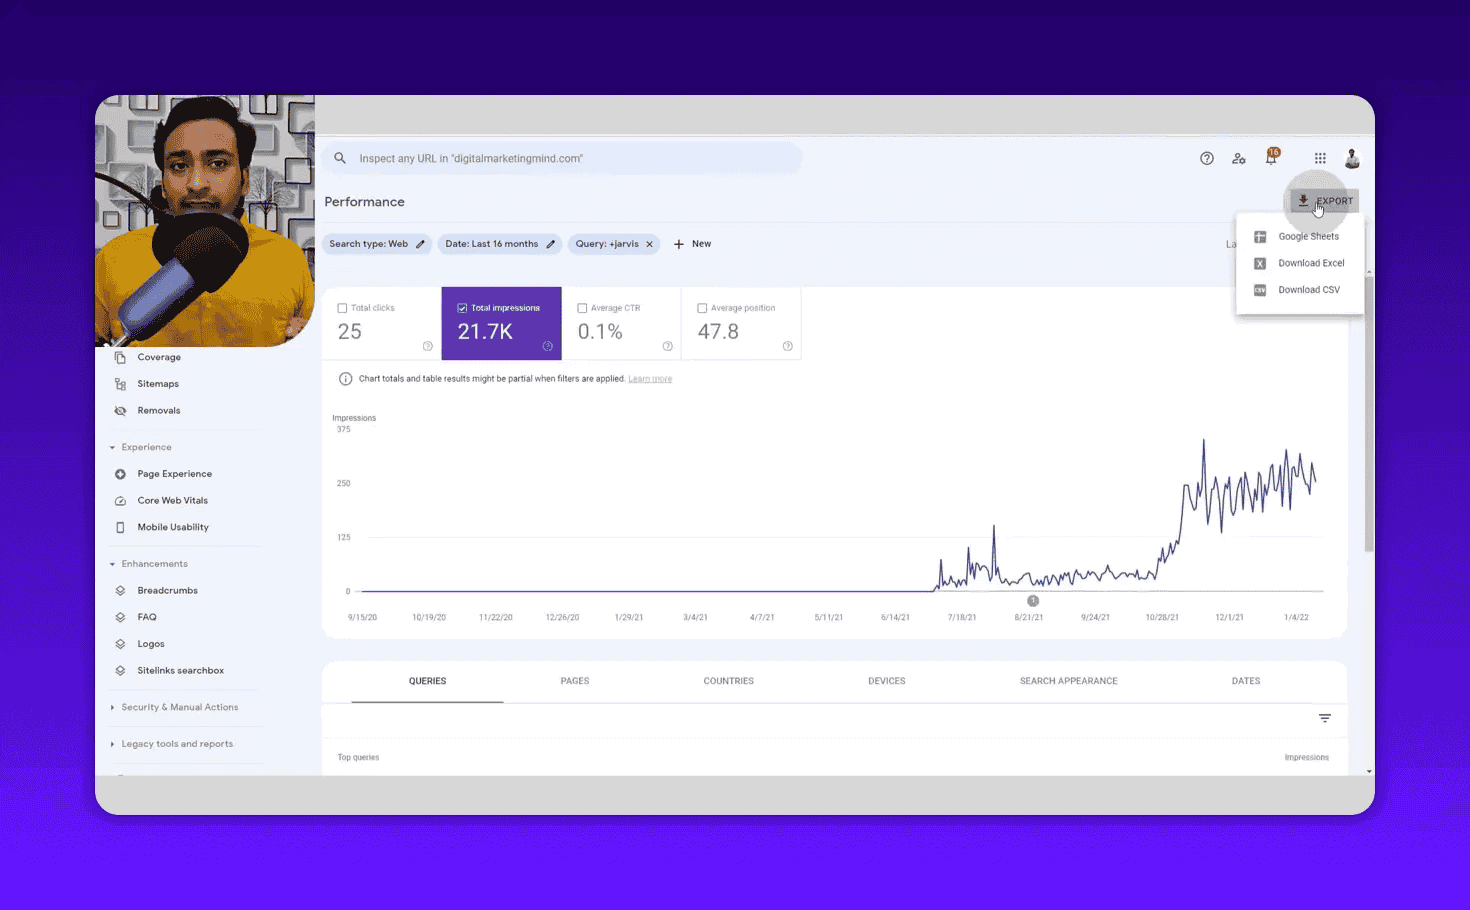
One important note: the table is limited to 1,000 rows per view. To get more data, apply different filters and export in batches. You can export to Google Sheets, Excel, or CSV using the Export button.
Step 3: Find Low-Hanging Fruit (Position Filter)
This is the technique that produces the fastest traffic wins.
Goal: Find keywords where you are already ranking in positions 11-20 but getting zero or near-zero clicks. These pages are on page two of Google. A modest improvement in content quality, internal linking, or on-page SEO could push them to page one.
How to do it:
- In the Queries table, click Add filter
- Select Position > Smaller than > Enter 20
- Add another filter: Clicks > Equals > Enter 0
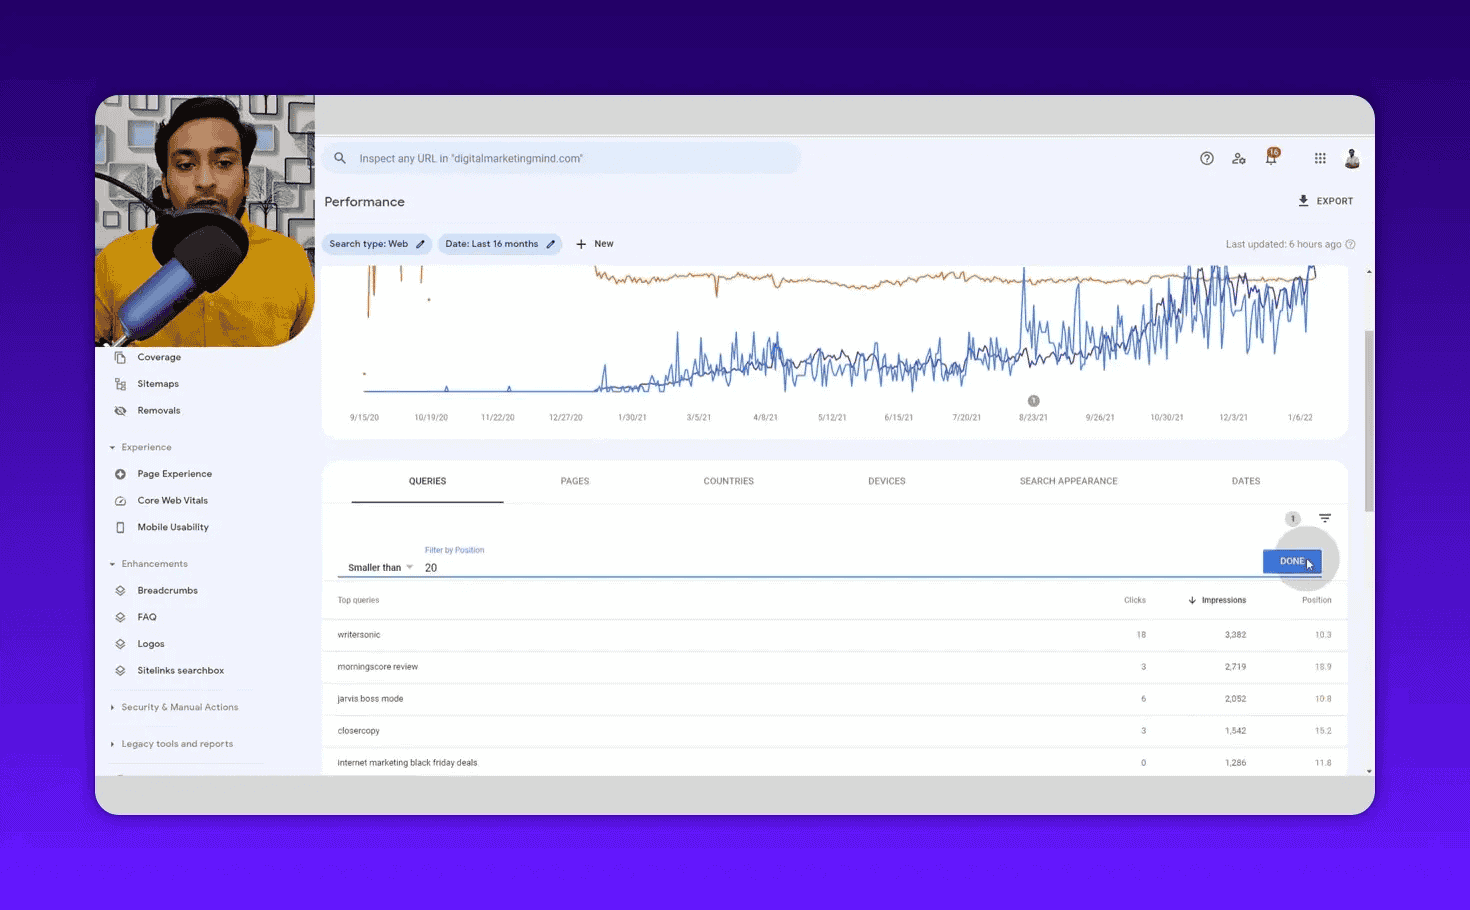
Now sort the results by impressions, descending. The keywords at the top have the most search demand and you are getting zero clicks despite being close to page one.
For each keyword, ask: does my site have dedicated content for this? If not, create it. If yes, is it optimized with this keyword in the title, H1, meta description, and body? If the keyword only appears once buried in a paragraph, optimize it.
This filter is the single most actionable keyword research technique inside GSC. I run it every month without exception.
Step 4: Use the Pages Tab for Semantic Keyword Clustering
Switch from Queries to the Pages tab.
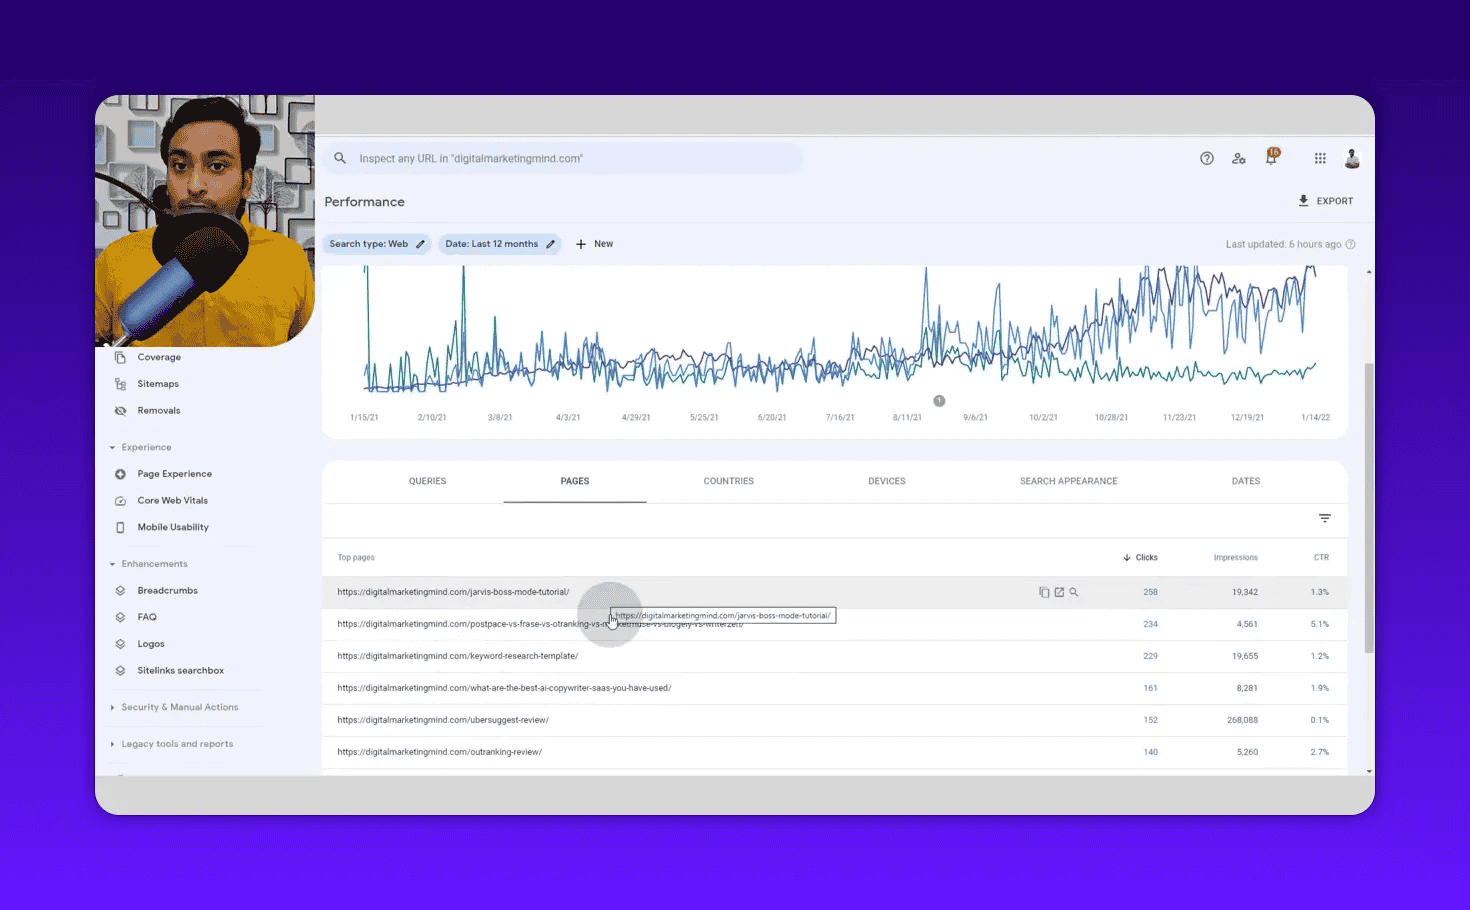
This shows your top-performing URLs by clicks and impressions. Now click on any page URL. GSC will filter the Queries table to show only the keywords associated with that specific page.
Here is why this is powerful: Google may be ranking your one article for 200-400 different keyword variations. That tells you the full semantic footprint of that content, the topical clusters your page is already associated with.
Export that list and group the keywords by theme. You will find:
- Primary topic keywords (usually your main phrase)
- Long-tail variations you are ranking for but not explicitly targeting
- Related questions your audience asks
- Sub-topics worth creating separate articles about
This is Google doing your keyword clustering for you. Take the output and turn it into a content expansion plan.
Step 5: Identify Intent Mismatches
High position, low CTR = intent problem.
If you are ranking position 5 for a keyword but your CTR is 0.3% (when industry average for position 5 is around 7%), something is wrong. Either:
- Your title tag and meta description do not match what searchers want to see
- The page content does not match the search intent for that query
- Google is showing your page for a keyword it should not rank for
To find these:
- Set a filter: Position < 10 (top 10 rankings only)
- Sort by CTR, ascending (lowest first)
The keywords that appear at the top are your intent mismatch candidates. A keyword in position 7 with 0% CTR is a red flag. Click on that keyword row, then click the Pages link to see which URL ranks for it. Visit that page and ask whether the content genuinely serves someone searching that query.
Sometimes the fix is updating your title tag to better match searcher intent. Sometimes you need to rewrite a section of the page. Sometimes you should create a dedicated page for that query and deoptimize the current page.
Step 6: Spot Opportunities Using the Countries Tab
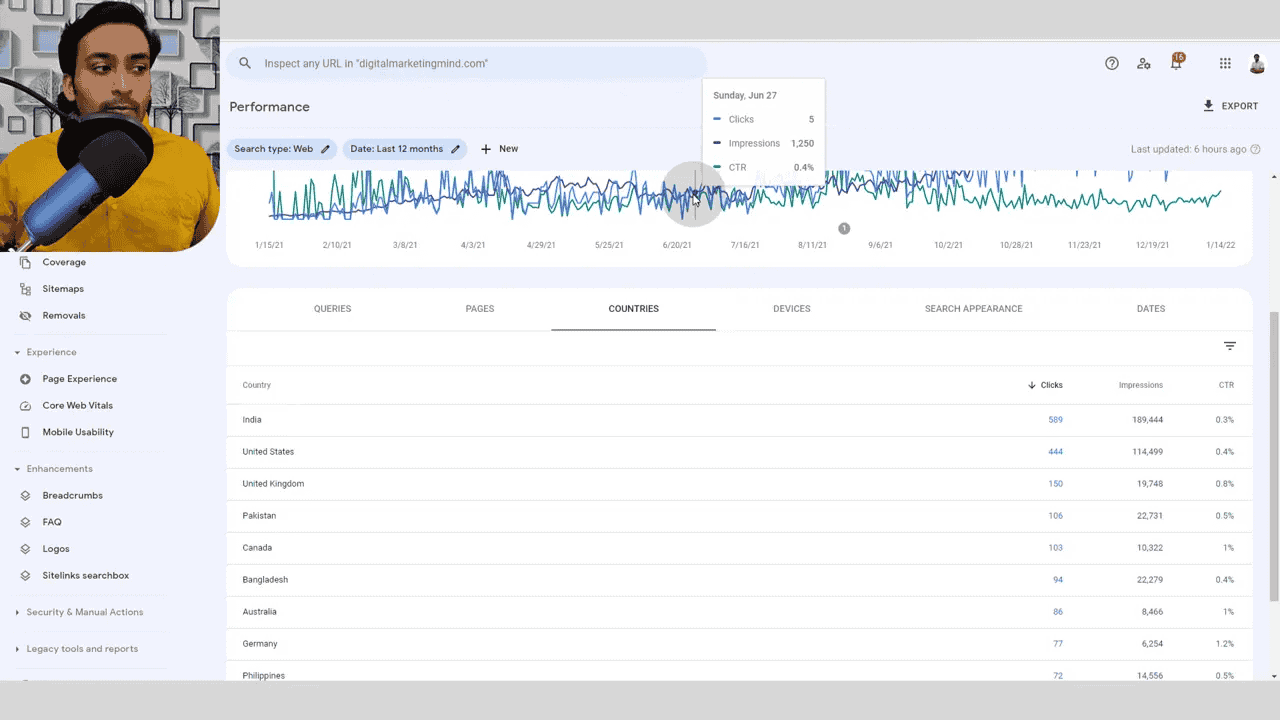
The Countries tab breaks down your performance by geography. This helps you answer two questions:
- Which countries are my biggest traffic sources?
- Are there high-impression markets where I am getting very low CTR?
A country with high impressions and low CTR means your content is appearing for searchers there but not earning clicks. That could indicate a localization opportunity, if a significant portion of your audience is searching in British English, for example, and your content uses American spellings or examples, your CTR may suffer.
Click on any country row to filter all other tabs by that specific geography.
Step 7: Analyze Device Performance
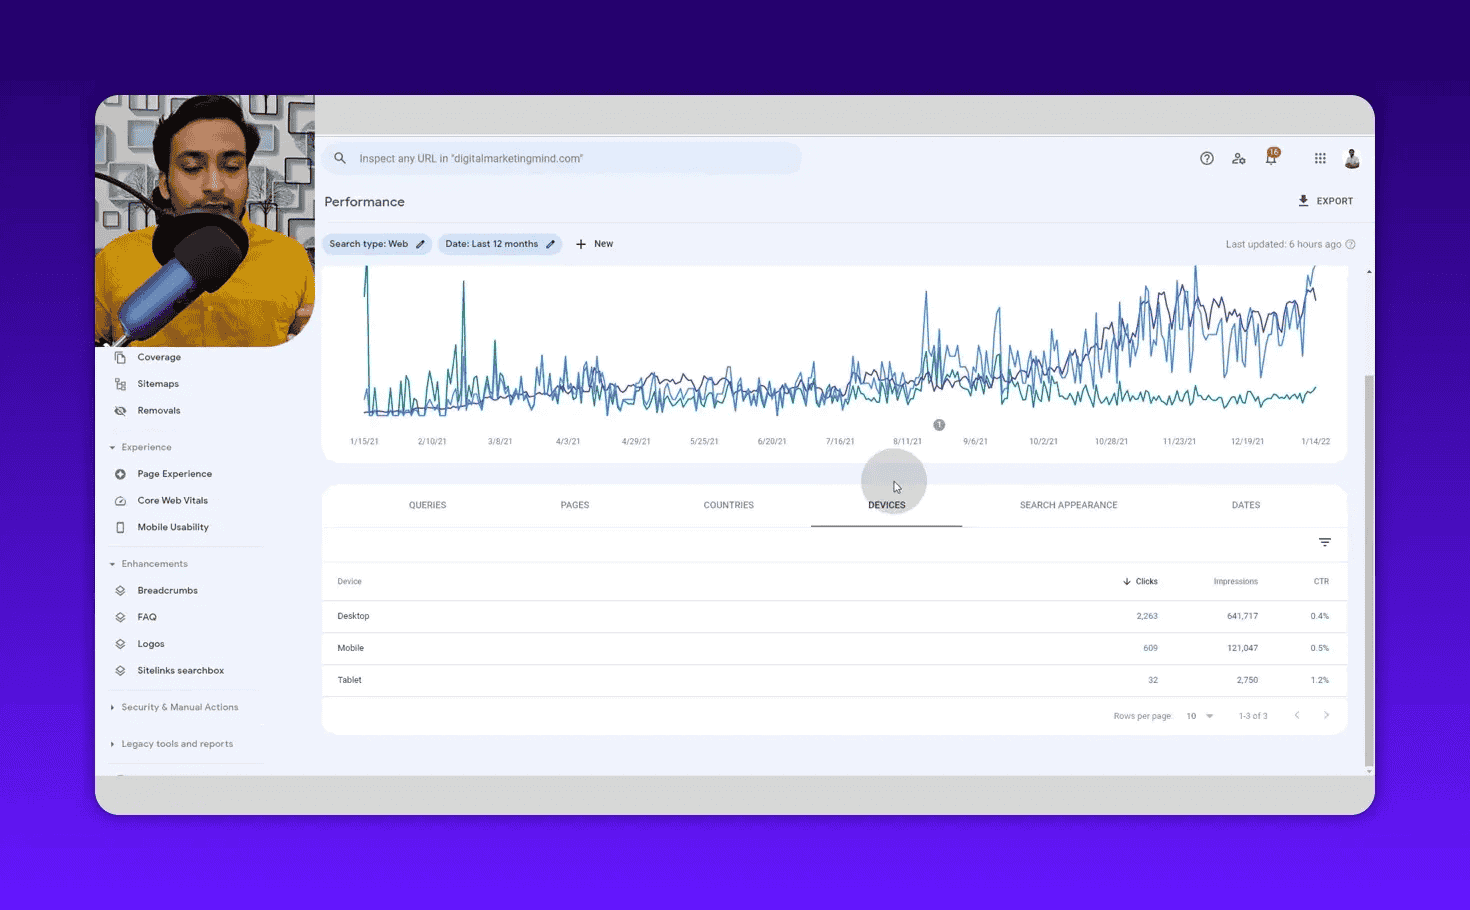
The Devices tab shows your split between Desktop, Mobile, and Tablet. For most SEO-focused content sites, desktop tends to dominate. For lifestyle, recipe, or local content, mobile often leads.
Why this matters for keyword research: device data can reveal optimization priorities. If you are getting 80% of impressions from mobile but your mobile CTR is half your desktop CTR, there is a specific problem. Maybe your title tags are getting truncated on mobile. Maybe your featured snippet strategy is not working on mobile SERPs.
Click on a device type to filter all your keyword data for just that audience segment.
Step 8: Use Search Appearance to Prioritize Content Formats
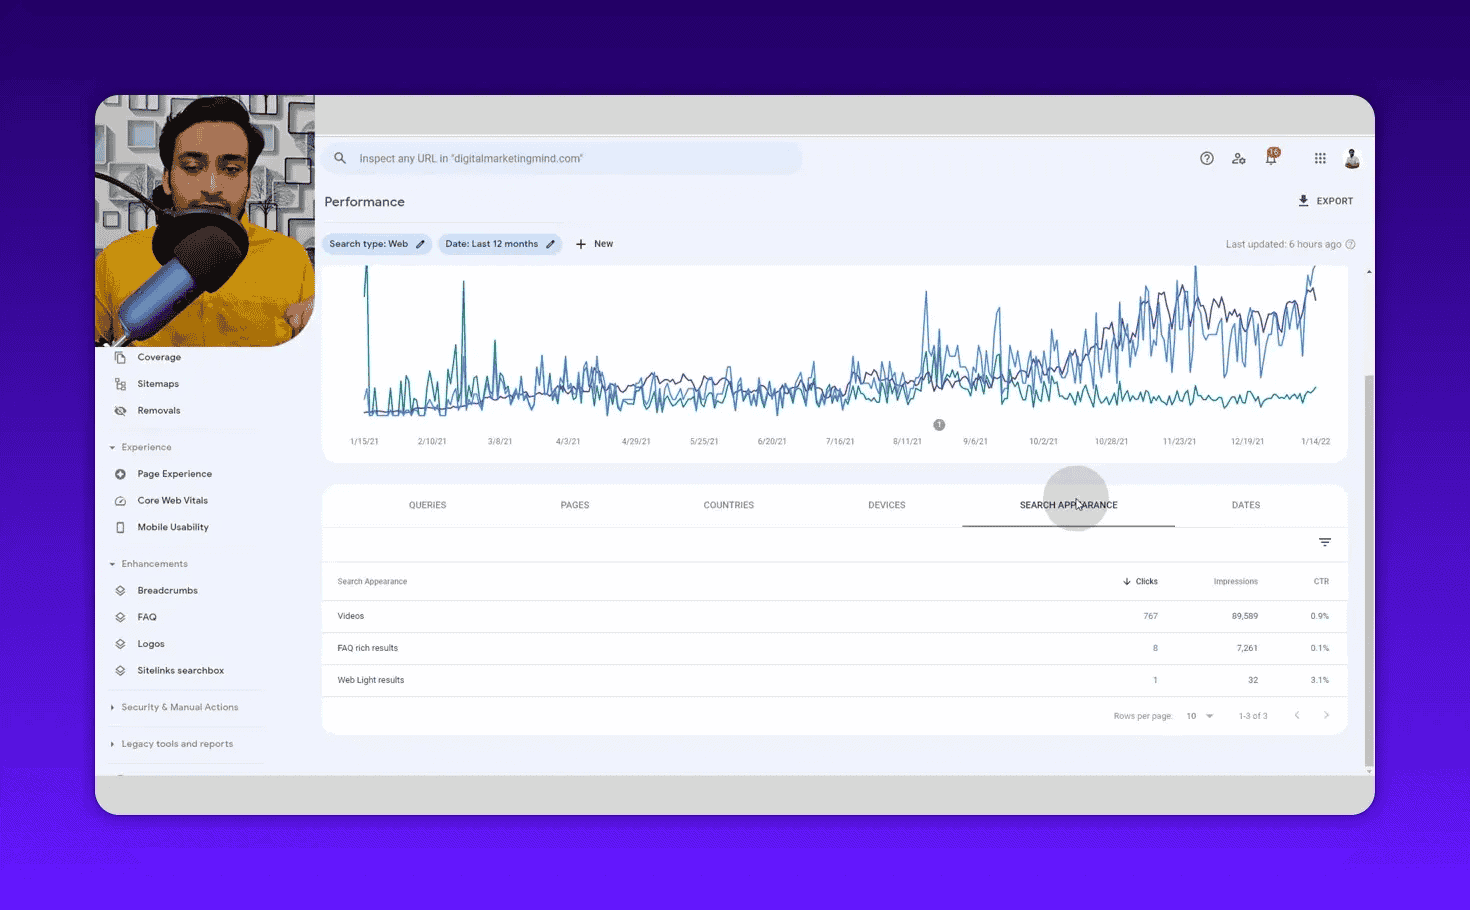
Google has over 20 different SERP features: featured snippets, video carousels, image packs, People Also Ask, job listings, and more. The Search Appearance tab shows which of these your content is appearing in and how many clicks each format generates.
If your video content is generating significant clicks through the video SERP feature, that is a signal to create more video content on related topics. If you have zero appearances in the featured snippet section despite strong rankings, that is a format optimization opportunity.
The Search Appearance data helps you prioritize format decisions, not just keyword decisions.
Step 9: Monitor Seasonal Patterns with the Dates Tab
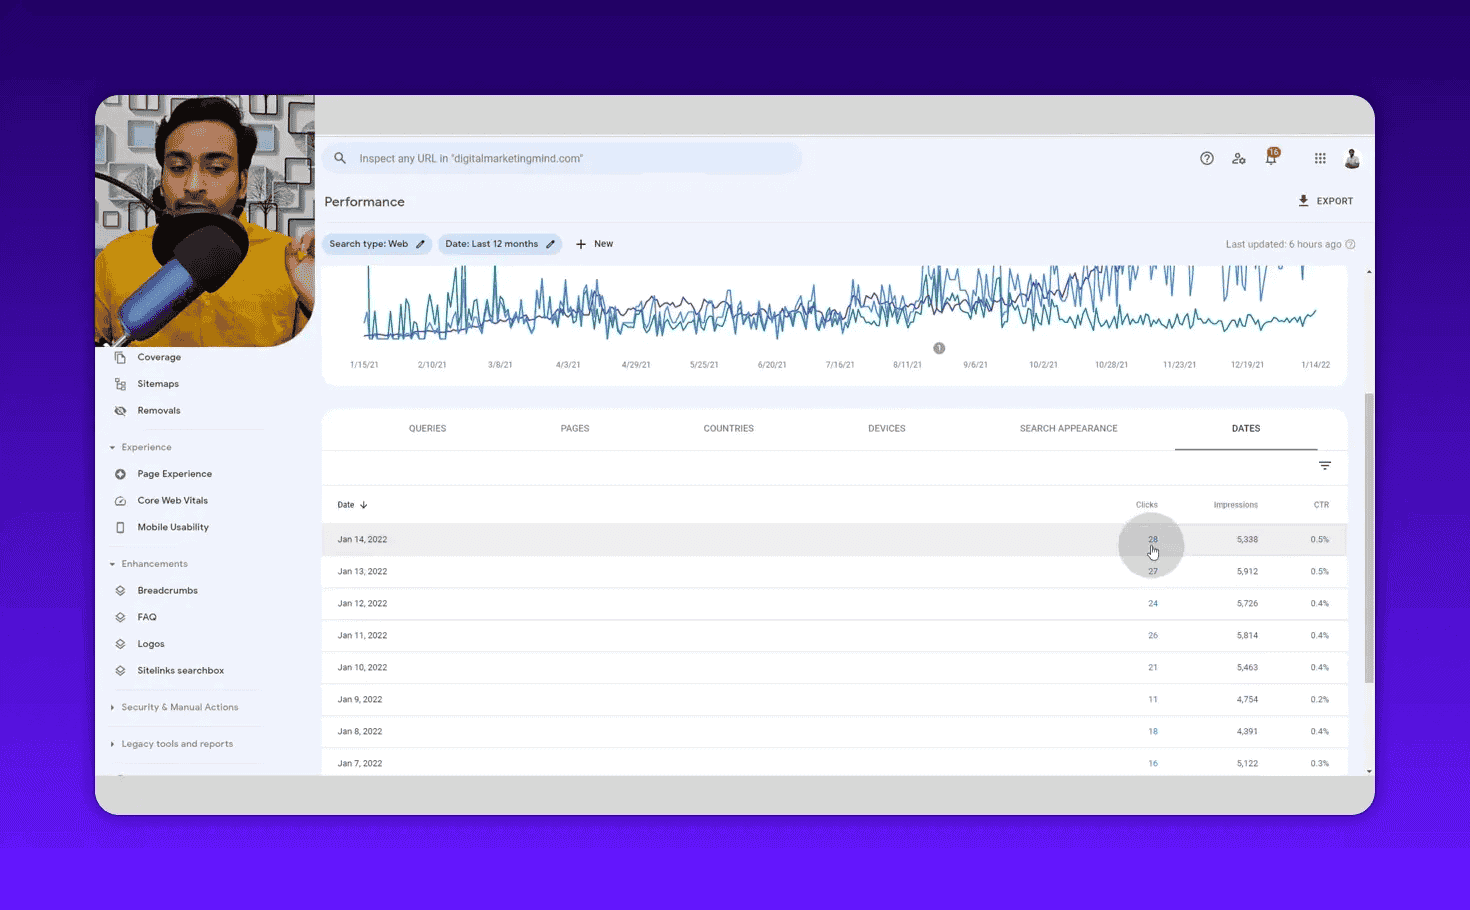
The Dates tab shows daily performance data. Use it in combination with a keyword filter to detect seasonality.
Go to the Queries table, search for a specific keyword (such as “black friday deals” or “summer recipes”), then switch to the Dates view. If you see a sharp spike in impressions during a specific period each year, that is a seasonal keyword.
For seasonal keywords, the strategy is simple: publish or update content 6-8 weeks before the peak. If Black Friday searches spike in November, your content should be optimized and building links by October.
Advanced Keyword Research Techniques
Find Buying Intent Keywords by Filter Word
You can find commercial intent keywords by filtering the Queries table by specific words. Type “review” in the query filter and you will see every query containing that word, all commercial intent keywords your site is already ranking for.
Try these filters:
- “review”, commercial/purchase intent
- “best”, comparison intent
- “how to”, tutorial intent
- “vs”, comparison/decision intent
- “price”, transactional intent
Each filter reveals a segment of your keyword inventory with different content and monetization implications.
Identify Negative Keywords for PPC Campaigns
If you run Google Ads alongside your organic strategy, GSC gives you a head start on your negative keyword list. Sort the Queries table by impressions and look for keywords that are irrelevant to your business.
For example, if you sell premium SEO software, any query containing “free” might be a negative keyword for paid campaigns. Filter by “free” and export the list directly into your Google Ads negative keyword manager.
Brand Keyword Monitoring
Filter the Queries table by your brand name. This tells you:
- How many people search for your brand directly
- What modifier phrases they add (“brand + review,” “brand + pricing,” “brand + alternatives”)
- Which pages rank for branded queries
- How brand search volume trends over time
Brand search volume is one of the clearest signals of brand equity growth. Track it monthly.
Compare Two Keyword Segments Side by Side
GSC has a built-in compare function. You can compare:
- Two date ranges (this year vs. last year)
- Two search types (web vs. image)
- Two query segments (by adding two query filters)
To compare how two different keyword groups perform, apply a query filter for the first term, then use the Compare function to add a second query filter. GSC will show side-by-side impressions, clicks, and CTR data for both.
Find Dying Keywords Early
Filter the Queries table by a keyword, then switch to the chart view to see the impression trend over time. If a keyword shows consistently declining impressions quarter after quarter, it is losing search demand.
Catching dying keywords early lets you redirect your content investment to growing topics instead of defending shrinking ones. This is particularly important for technology and tool comparison content where platforms rise and fall quickly.
The Most Effective GSC Keyword Research Workflow
Here is the exact workflow I use every month:
- Set date range to 16 months, maximum data available
- Export the full Queries table to Google Sheets as a baseline
- Run the low-hanging fruit filter, position < 20, clicks = 0, sort by impressions
- For the top 10 low-hanging fruit keywords, check: does a dedicated page exist? Is the keyword in the title, H1, and meta description?
- Switch to Pages tab, click each top-10 page, export the semantic keyword cluster for each
- Check for intent mismatches, position < 10, sort CTR ascending, investigate the bottom 10
- Review Countries and Devices, identify underserved markets or device gaps
- Filter by a buying-intent word (“review,” “best,” “pricing”), identify monetizable content to prioritize
This workflow takes about 45 minutes. The output is a prioritized list of content optimization opportunities, new article ideas, and PPC negative keyword additions, all from a free tool that pulls directly from Google.
For deeper keyword research on competitor gaps and new topic discovery, I combine this workflow with the Semrush Organic Research tool and the Semrush Keyword Gap. GSC handles the “optimize what you have” side. Semrush handles the “find what your competitors have that you don’t” side.
What Google Search Console Cannot Do
Be honest about the tool’s limits:
- No competitor data, GSC only shows your site. To see competitor keywords, use Ahrefs or Semrush
- No search volume data, GSC shows impressions, not monthly search volume estimates. For volume data, cross-reference with Semrush or Google Keyword Planner
- Data delay, GSC data is typically 2-3 days behind real-time
- 1,000-row cap, Each filtered view shows maximum 1,000 rows. Work around this by applying narrower filters and exporting multiple segments
- No new keyword discovery, If your site has never ranked for a topic, GSC will not suggest keywords in that space
For all of these gaps, I use paid SEO tools alongside GSC. But GSC is always the starting point, because it is the only tool that shows me what Google actually sees.
GSC vs. Paid Keyword Tools: How to Use Both
| Use Case | Best Tool |
|---|---|
| Find keywords your site already ranks for | GSC |
| Find low-hanging fruit (page 2 keywords) | GSC |
| Monitor CTR and snippet performance | GSC |
| Detect intent mismatches | GSC |
| Find brand keywords | GSC |
| Seasonal keyword trends for your site | GSC |
| Discover new keywords you do not rank for | Semrush / Ahrefs |
| Competitor keyword gaps | Semrush Keyword Gap |
| Monthly search volume estimates | Semrush / Ahrefs |
| Keyword difficulty scores | Semrush / Ahrefs |
Frequently Asked Questions
How long does it take before Google Search Console has usable data?
Set up your GSC property the day you launch your site, then publish consistent content. After roughly 3 months of publishing and indexing, you will have enough keyword data to run meaningful analysis. New sites with very little content may need 4-6 months.
How many keywords does Google Search Console show?
GSC shows up to 1,000 rows per filtered view. To access a broader keyword set, apply different filters (date ranges, device types, countries, query filters) and export each segment separately. The total keyword pool available for a mature site is in the thousands.
Is Google Search Console data accurate?
GSC is the most accurate keyword data available because it comes directly from Google. The only caveat: average position is an average across all queries and devices, which can be misleading for high-volume keywords that rank differently across locations. For deeper position accuracy, use a dedicated rank tracker alongside GSC.
Can I use GSC for keyword research if my site is new?
Not immediately. GSC shows data only for keywords that have generated impressions on your site. A brand-new site with no published content or rankings will show empty tables. Focus on publishing quality content first, let Google index it, and return to GSC after 3 months of activity.
What is the difference between clicks and impressions in GSC?
Impressions count how many times your URL appeared in a search results page, whether the user scrolled to see it or not. Clicks count how many times a user actually clicked on your URL from that results page. CTR is clicks divided by impressions. A high impression count with low CTR indicates your ranking is visible but your snippet is not compelling enough to earn the click.
How do I find low-competition keywords in GSC?
Use the position filter. Set position < 20 with clicks = 0 and sort by impressions descending. These keywords already have measurable search demand (as shown by impressions) and your site is within striking distance of page one. They are the lowest-effort path to traffic increases because Google has already associated your content with those queries.
Next Steps
You have now covered every major use case for GSC as a keyword research tool. The next step is to combine this data with external keyword research for a complete picture.
If you want to find keywords you are currently missing entirely, start with my free keyword brainstorming method before moving to paid tools. For understanding what your competitors rank for that you do not, the Semrush Organic Research guide covers the complete workflow.
And if you have noticed a traffic drop that you cannot explain, run your domain through my free Google penalty checker tool before spending hours in GSC looking for a keyword problem that might actually be an algorithm issue.